30 Days to Success in Power BI
In the SQL Server community, I’ve seen quite a few 30 day blogs. I love the format with the idea being that you read the blog once a day for a month to master a new skill. Let’s go on adventure to learn PowerBI!
PowerBI is the latest Microsoft Business Intelligence tool. This tool, however, is considered a self-service tool in that it lets users create the data visualizations that they want to see instead of waiting for your in-house report writers to create a report for you. Excited yet? Don’t worry, you will be. It is a fun tool. Let’s get started.
Recently, I completed my first PowerBI project for a client of ours at Innovative Architects. It only took a couple of days to deliver multiple dashboards and they were beautiful if I do say so myself. This project inspired me to blog about getting started with PowerBI.
So day one needs to be getting PowerBI installed and ready to go. The first thing we do is to download the software at https://powerbi.microsoft.com/en-us/get-started/ using an email address. This is important because PowerBI is getting monthly updates and the tool is adding features every month. You really want to know about them as they are released.
- Let’s start the installer and get this party going!
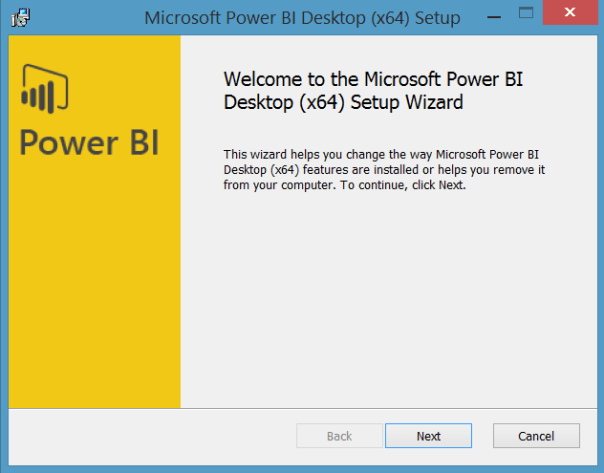
Figure 1: Basic Installer Starting Point
- Strait forward so far, right? Click Next.
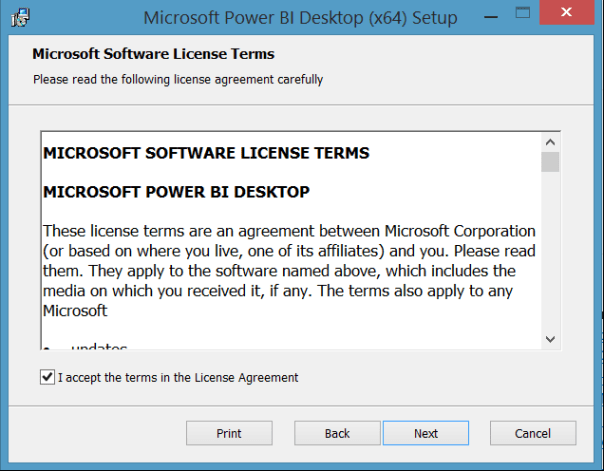
Figure 2: Basic License Acceptance Screen
- Check the acceptance box and then click Next.

Figure 3: Choose an Installation Folder
- Choose an installation folder by clicking Change or click Next to continue with the default location.
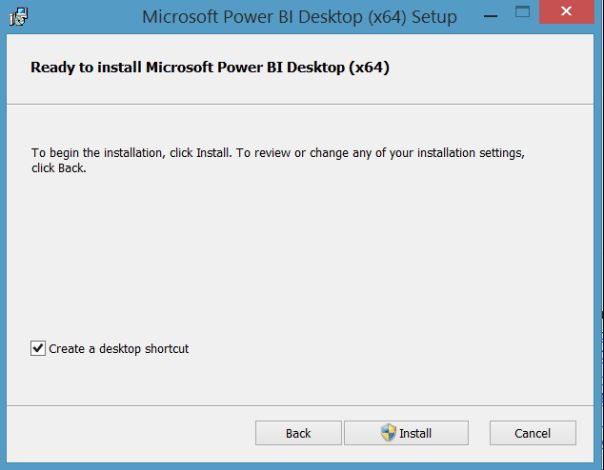
Figure 4: Let’s Install Now!!
- Click Install to begin.
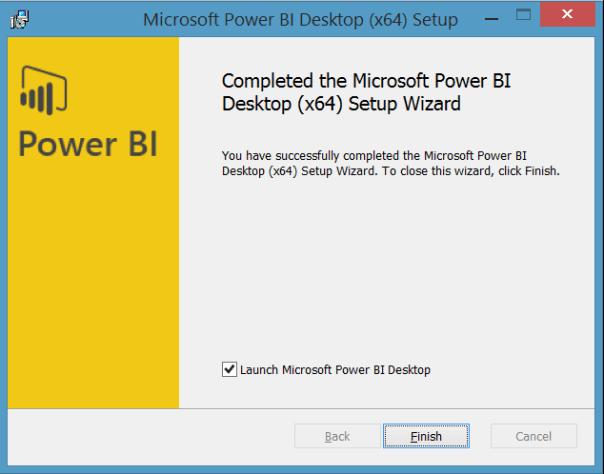
Figure 5: We’re Done!
- Click Finish to end the installation. Wow, that was easy!
I told you it would be fun, right? We have now installed PowerBI Desktop. We’re should probably take the rest of today off. See you tomorrow!
Read the full series here:
- Day Two: Loading a Web Data Source
- Day Three: General Housekeeping
- Day Four: Our First Visualization
- Day Five: Making It Pretty
- Day Six: Adding More Data
- Day Seven: Adding Simple Analytics
- Day Eight: Adding More Analytics
- Day Nine: Line and Clustered Column Chart
- Day Ten: Add New Calculated Columns
- Day Eleven: Adding a Second Visual
- Day Twelve: Adding a Slicer
- Day Thirteen:
- Day Fourteen:
- Day Fifteen:
Posted on February 13, 2017, in Business Intelligence, PowerBI and tagged PowerBI. Bookmark the permalink. 1 Comment.


Pingback: 30 Days to Success in Power BI: Day Two Loading a Web Data Source | SQL Swampland