Monthly Archives: July 2018
30 Days to Success in Power BI: Day Twenty-Three Drillthrough
Welcome back to day twenty-three of our thirty-day series on Success in Power BI! Have you forgotten where we left off from day twenty-two? If so, here is the link to refresh your memory.
Today we will be discussing Drillthrough. Drillthrough allows you to drill through to more details. For example, you have a chart that summarizes Sales Amounts by Years. When you see this visualization, you realize that it would be useful to be able to drill through the chart and see all of the data that is summarized for the selected year. Let’s try this using our AdventureWorksDW2014 data-driven Power BI report from the last few posts. If you remember we had a Stacked Column Chart displaying Sales Amount by the Order Date hierarchy.
Let’s create a second report page and name it Order Details. On this page, add Order Date (as a date and not a hierarchy) and Sales Amount from FactInternetSales and FirstName and LastName from DimCustomer. This will give us some basic order details as shown in Figure 1.

Figure 1 – Order Details
On the Order Details page, drag the Year value from Order Date in FactInternetSales to the Drillthrough filter area as shown in Figure 2. This will be our link to the main page to allow us to drillthrough based on the year of the order date. So when we are viewing Sales by Year on our main chart, we can choose to drillthrough and see all of the individual order that made up that year.

Figure 2 – Drillthrough Filter
Keep in mind that you can hide these drillthrough detail report pages and allow them only to be seen on the drill through action. Because of this feature, Power BI places an arrow in the upper left hand corner to allow you to return from whence you came. You can edit the appearance of the arrow and when the end-user presses the arrow they are returned to the original report. Personally, I chose to make the arrow a little larger and change the color to red to make it more obvious as shown in Figure 3. We should also at this point name the report page tab at the bottom of the report so that when we try to drill through it will be obvious as to what page we want to drillthrough to as shown in Figure 4. Here we see the page name of Order Details to the right of the drillthrough menu. If there were multiple pages we would have to choose a particular page here.
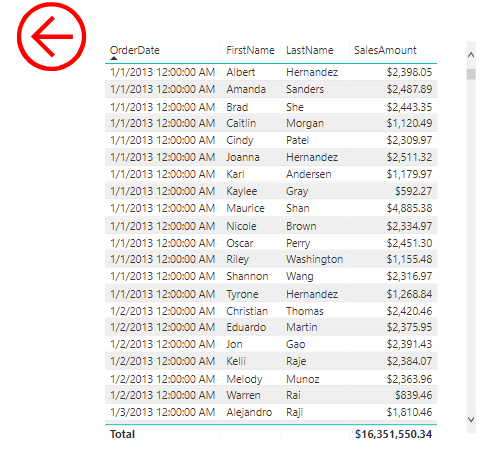
Figure 3 – Detail with Return Arrow
So now that we’ve gotten a little ahead of ourselves, let me explain how we got to that menu. In our Stacked Column Chart, we are at the Sales Amount by Year hierarchy level of our visual, thus the OrderDate year is in scope for our data. This is important because we chose Year as our drillthrough filter. If we right-click on one of the years inside the chart, we can drill through as shown in Figure 4. If you are not hovering over a particular year, then the drillthrough option will not be available in the context menu. It is also important to note that if you drill down or move to the next level and do not have year in scope, then the drillthrough feature to the year filter on Order Details will not be available. Similarly, you could create additional report pages to provide different details to those levels as well. Stay tuned for our next adventure with Power BI!!!

Figure 4 – Let’s Drillthrough Now!


