30 Days to Success in Power BI: Day Ten Add New Calculated Columns
Welcome back to day nine of our thirty-day series on Success in Power BI! Have you forgotten where we left off from day nine? If so, here is the link to refresh your memory.
We are going to switch gears today and manipulate some of our data set for future lessons. We have the Awards field currently which has a few different awards delimited by comma. We want to separate out this data into separate columns to report on.
- Go back to the data view (on the left hand ribbon middle icon).
- Right click anywhere inside the grid and choose New Column (as shown in Figure 1).
- Type in the following (replacing Column = as shown in Figure 2): AllStar = IF((FIND(“AS”,’Standard Batting'[Awards],1,0)) > 0,”Yes”,”No”)
- Repeat steps two and three: GoldenGlove = IF(FIND(“GG”,’Standard Batting'[Awards],1,0) > 0,”Yes”,”No”)

Figure 1 – Adding a New Column
This language is called DAX or Data Analysis Expressions and it is a library of functions and operators that are used to build expressions and formulas for Analysis Services (SSAS), Power BI Desktop, and Power Pivot for Excel. Here is an MSDN reference for DAX. And here is a quick reference that I refer to in order to know which function will fulfill my needs.
To summarize what we did above in the steps: we added two new columns called AllStar and GoldenGlove. We looked at the Awards column for AS or GG and used some DAX functionality to return a Yes or a No into these separate columns. Now these awards have more meaning to use other than the long string of awards for that year. Stay tuned to see how we use them!
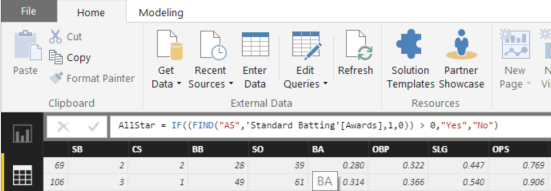
Figure 2 – Using DAX for a New Column
Posted on March 7, 2017, in Business Intelligence, PowerBI and tagged PowerBI. Bookmark the permalink. 3 Comments.


Pingback: 30 Days to Success in Power BI | SQL Swampland
Pingback: 30 Days to Success in Power BI: Day Eleven Adding a Second Visual | SQL Swampland
Pingback: 30 Days to Success in Power BI: Day Fourteen Update Power BI | SQL Swampland