30 Days to Success in Power BI: Day Two Loading a Web Data Source
Welcome back to day two of our series on Power BI! Are you sore from yesterday’s heavy lifting? No? Good. Did you forget where we left off? Here is the link to refresh your memory.
Today we are going to start with loading some data from a web data source. There are a ton of great data sources out there but I chose Baseball-Reference.com because of the wealth of information and statistics available there and I personally love baseball. It doesn’t matter if you are a baseball fan or not as this is just a demonstration. Feel free to find a different site for your favorite sport or activity.
Hank Aaron is generally considered to be one of the greatest baseball players of all time so we will grab some of his statistics and break them down in Power BI. With my company, Innovative Architects, being based in Atlanta, we’re pretty fond of Mr. Aaron here at the office. So let’s see where this takes us for this adventure.
Let’s start with opening Power BI. We are greeted each time with this great modal dialog box. It is a great spring board. We can open a previous project or start a new one by clicking on Get Data.

- Select Get Data to get started on our journey.
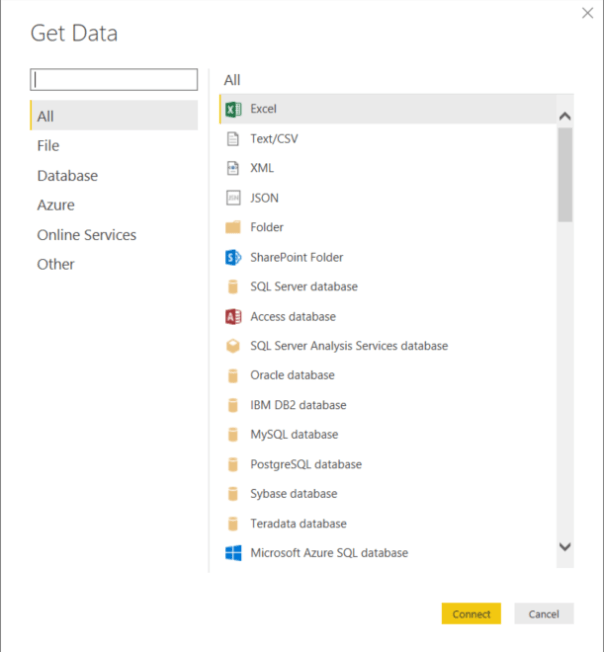
- Select Other to get to the Web data source option and select Connect.

- Select Web. Type in http://www.baseball-reference.com/players/a/aaronha01-bat.shtml and select Ok. This page will give us some lifetime stats for Hank Aaron so we can do some visualizations.

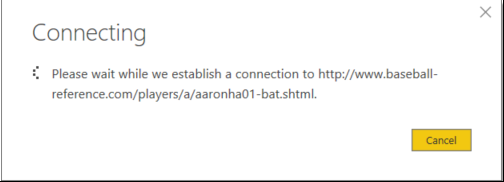
- We are now connecting to the data into Power BI.

- Now the fun part: figuring out which data that we want to load. Look at all of these tables. Which one is ours?

- Let me show you a trick. Click on the Web View tab around the middle of the screen. It will show our web page data as it appears normally. However, it will also label the tables so that we know which one we want to load. Snazzy, huh?
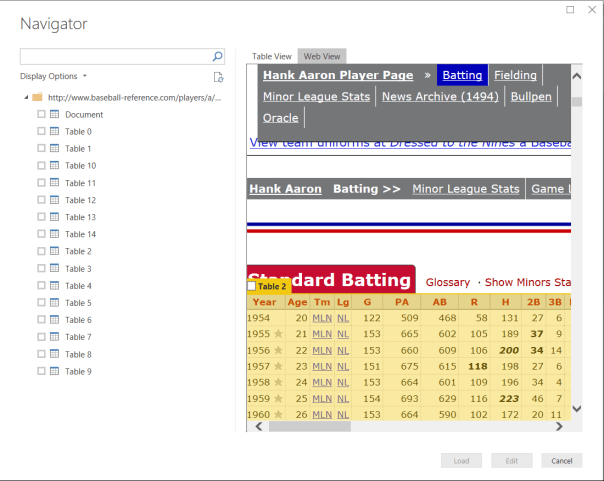
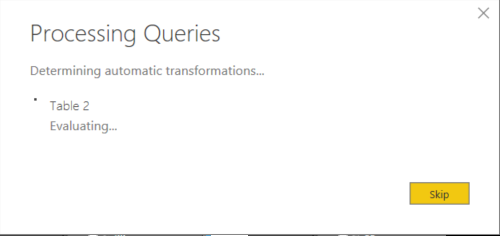
- From here we can click on the Table 2 check box near the Standard Batting title for the table. That was much easier, huh? Select the Load button and Power BI will now start to load the data into the tool.

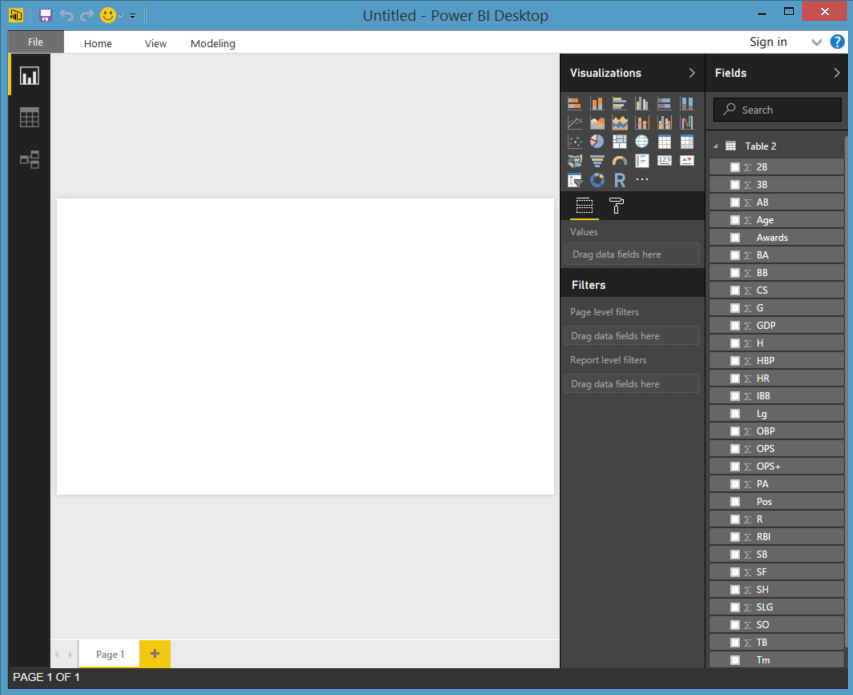
- When that completes, we will actually have data loaded into Power BI to begin our work. If you look at table 2 on the right, you can see all of the columns that we saw on the web page.

- If we click on the data icon in the middle of the three icons on the right hand side of the screen, we can actually see the data. The other two show the report and the relationships between tables. We will get into that later on.

- Let’s Save the File as Hank Aaron and pick up again on Day Three. Good job! We are data visualization gods, right?


Posted on February 14, 2017, in Business Intelligence, PowerBI and tagged PowerBI. Bookmark the permalink. 2 Comments.


Pingback: 30 Days to Success in Power BI: Day Three General Housekeeping | SQL Swampland
Pingback: 30 Days to Success in PowerBI | SQL Swampland