30 Days to Success in Power BI: Day Twelve Adding a Slicer

Figure 1 – Slicer
Welcome back to day twelve of our series on Success in Power BI! Here is the link to refresh your memory on yesterday’s work on our Hank Aaron project. We now have two visuals on our page and today we are going to add a slicer. Some of my favorite meals came from slicers…wait that doesn’t seem right. Well in that case just ignore Figure 1.
Just like delicious cold cuts, the Power BI data slicer is used to take a large amount of data and make it smaller. In this case we use slicers to filter data, in other words, to get to the heart of the data. Make sense? It is a visual filter made available on our page to filter through the data in real time. Exciting! Let’s pick up where we left off….remember when I said we needed some extra space at the bottom of the page? Good, you’re now ready to begin if your page looks like Figure 2.

Figure 2 – Let’s Slice This Data Like Roast Beef

Figure 3 – Adding the Age Field
- Click somewhere in the white space at the bottom of the page to ensure that neither of our visuals are selected and then select the Age field in the Fields pane on the right hand side. This will default in a nice little clustered column chart (Figure 3) where it adds the ages from each of our records to give us a grand total of 713. This data is useless as this is not a field to sum up. But we need it here, for now.
- With that visual still selected let’s choose the Slicer in the Visualization pane as shown in Figure 4 using the blue arrow. Our clustered column chart has now changed to a list of check boxes representing each age of data in the data set.
- Check some boxes and watch how the TWO visuals change. We are seeing his totals move depending upon the age. This. Is. Awesome!
- Hold the Ctrl button and select multiple ages and watch the visuals change as shown in Figure 5. Notice the changes in the line and clustered column chart. You can actually see that some ages are missing by the gaps. Even the trend lines move. We must be careful with this to prevent a misleading representation.
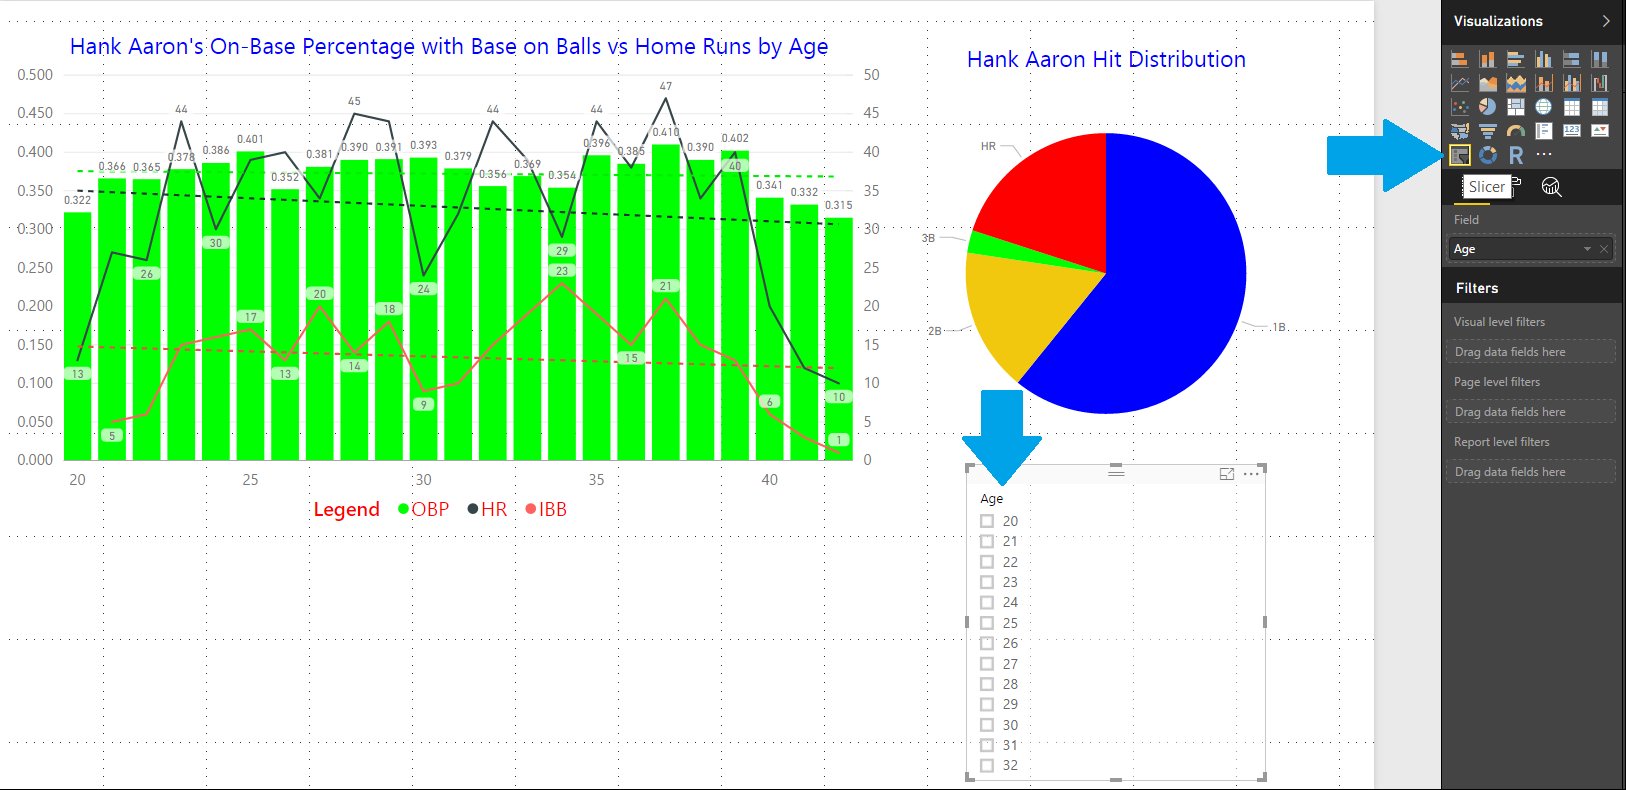
Figure 4 – Slicing Time!
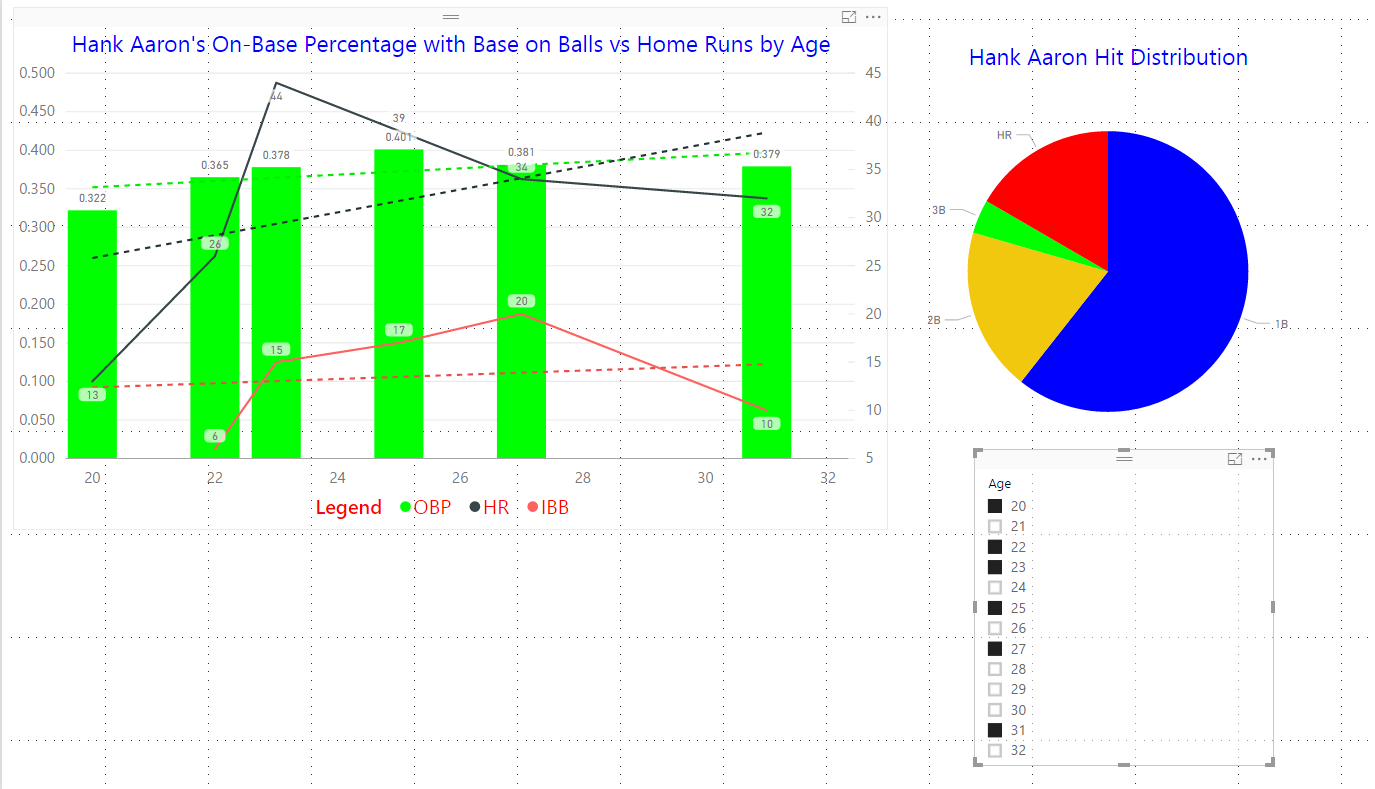
Figure 5 – Slice and Diced
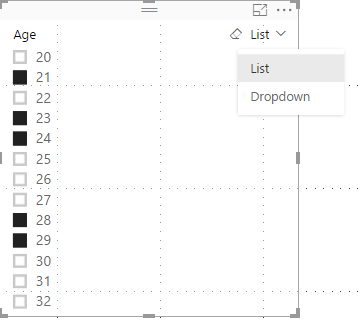
Figure 6 – Drop Down Slicer
That list of check boxes is really unnecessarily expensive in page real estate terms. We can change that into a drop down to prevent losing our valuable visual space. If you hover over it on the right hand corner you will see the word List with a down arrow. Select that and choose Dropdown. Our list is now much smaller as shown in Figure 7. What will we think of tomorrow? Stay Tuned!

Figure 7 – Less Page Real Estate Slicer
Posted on March 9, 2017, in Business Intelligence, PowerBI and tagged PowerBI. Bookmark the permalink. 2 Comments.


Pingback: 30 Days to Success in Power BI | SQL Swampland
Pingback: 30 Days to Success in Power BI: Day Thirteen Adding Additional Slicers | SQL Swampland