Blog Archives
SQL Nexus, Delayed with Error
I was hoping to continue our series today but I am running into an error while loading the trace files. I have spent the day with other production issues and have been unable to track down this error with ReadTrace. I hope to be able to blog about it next week. Stay tuned and enjoy your weekend.
SQL Nexus, Data Collection
Monday we started our SQL Nexus journey together in order for me to refresh my knowledge of how to use this awesome tool. On Tuesday, we installed some essential pieces in order to get the SQL Nexus tool installed and ready to use. We detoured on Wednesday to attend the SQL Server 2012 Technology Days at Microsoft in Tampa. Today we return to the fun, so let’s jump right back in!
I realized this morning that I left out another download, the SQL Server 2005/2008 Performance Statistics collection scripts. This has the XML configurations needed to run SQLDiag in order to load performance data into SQL Nexus. Well let me qualify that, these XML files are pre-configured and they can be modified if necessary. These configurations will capture DMVs and also blocking information that can help you troubleshoot performance problems. It will also collect machine information from Perfmon, msinfo32, various event logs, and the profiler trace (unless you run the NoTrace command script). There is more detailed information on customization available on the CodePlex download page (make sure you read the fine print about the download location as it is not the big download button on the right).
Once you run one of the scripts, such as StartSQLDiagDetailed_Trace2008R2.cmd, you will see several lines of preparatory messages followed by “SQLDIAG Collection started. Press Ctrl+C to stop.” At this point you can reproduce your issue, if possible. If not possible, then collect data for a few minutes and then press Ctrl+C to finish the collection and generate the output necessary for SQL Nexus. Be vigilant of running this as the output can grow very large very quickly especially if you running this against a production server. Be careful! Once the dialog closes, then the output is ready to load into SQL Nexus.
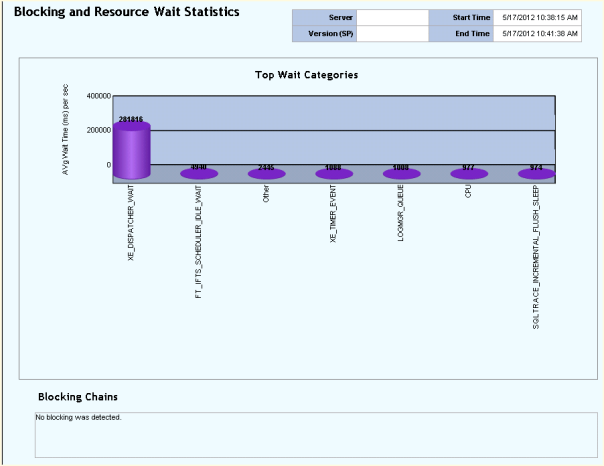
Now open SQL Nexus and we can import the data that is output from SQLDiag from the output folder that is generated underneath the folder where you ran the script from, by default. From there we can run some of the reports located on the upper left corner of the interface. Not all of them will apply depending upon what data you collected and which script ran. Below is a sample of the Blocking and Wait Statistics report. This was just a sample ran for this blog, so unfortunately I did not having any blocking issues to show you. I hope this helps your understanding of SQL Nexus. Enjoy!
SQL Nexus, Getting Started
Yesterday, we started a journey of knowledge refresh with the SQL Nexus tool available from CodePlex. Before we begin, it should be noted that this tool has not yet been updated to include SQL 2012, sorry, but it does cover databases from 2000 through 2008 R2. For clarification purposes, it does require at least the SQL Server 2005 database engine but will analyze SQL Server 2000 databases (at least it says that it does, but I do not have any to run it against so I cannot comment on the validity).
You will also need a few other items such as the Microsoft Report Viewer, (2008 or 2010 versions will work), you will need to update the Report Viewer (2008 or 2010 versions), install the Relay Markup Language Utilities (RML Utiltities), and then you will be able to install SQL Nexus. That almost felt like a Linux distribution with all of the required pieces.
The RML Utilities are pretty neat as they can help simulate application testing by replaying a production user load in a testing environment. This can be helpful in testing an upgrade to SQL Server or in applying patches and service packs. Tomorrow we will continue this journey. Enjoy!
SQL Nexus, an Introduction
Have you tried SQL Nexus yet? SQL Nexus allows you to import data from SQLDiag/PSSDiag, PerfMon, and PerfStats into a special database where you can then generate reports detailing performance issues based upon the imported data. Over the next couple of days, I will blog about using this tool as well as the SQLDiag/PSSDiag Manager tool. I have used these tools only a couple of times and need to refresh my knowledge, so feel free to come along for the journey. Enjoy!


