SQL Nexus, Data Collection
Monday we started our SQL Nexus journey together in order for me to refresh my knowledge of how to use this awesome tool. On Tuesday, we installed some essential pieces in order to get the SQL Nexus tool installed and ready to use. We detoured on Wednesday to attend the SQL Server 2012 Technology Days at Microsoft in Tampa. Today we return to the fun, so let’s jump right back in!
I realized this morning that I left out another download, the SQL Server 2005/2008 Performance Statistics collection scripts. This has the XML configurations needed to run SQLDiag in order to load performance data into SQL Nexus. Well let me qualify that, these XML files are pre-configured and they can be modified if necessary. These configurations will capture DMVs and also blocking information that can help you troubleshoot performance problems. It will also collect machine information from Perfmon, msinfo32, various event logs, and the profiler trace (unless you run the NoTrace command script). There is more detailed information on customization available on the CodePlex download page (make sure you read the fine print about the download location as it is not the big download button on the right).
Once you run one of the scripts, such as StartSQLDiagDetailed_Trace2008R2.cmd, you will see several lines of preparatory messages followed by “SQLDIAG Collection started. Press Ctrl+C to stop.” At this point you can reproduce your issue, if possible. If not possible, then collect data for a few minutes and then press Ctrl+C to finish the collection and generate the output necessary for SQL Nexus. Be vigilant of running this as the output can grow very large very quickly especially if you running this against a production server. Be careful! Once the dialog closes, then the output is ready to load into SQL Nexus.
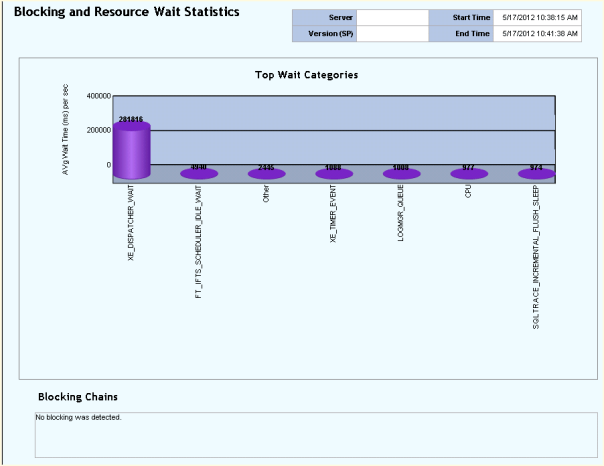
Now open SQL Nexus and we can import the data that is output from SQLDiag from the output folder that is generated underneath the folder where you ran the script from, by default. From there we can run some of the reports located on the upper left corner of the interface. Not all of them will apply depending upon what data you collected and which script ran. Below is a sample of the Blocking and Wait Statistics report. This was just a sample ran for this blog, so unfortunately I did not having any blocking issues to show you. I hope this helps your understanding of SQL Nexus. Enjoy!
Posted on May 17, 2012, in Monitoring, Troubleshooting and tagged Activity Monitoring, Maintenance, SQL Nexus, SQLDiag, Troubleshooting. Bookmark the permalink. 2 Comments.


Pingback: SQL Nexus, Read Trace Errors Resolved! « SQL Swampland
Pingback: SQL Nexus, Adding Additional Collection Events « SQL Swampland