30 Days to Success in Power BI: Day Fifteen Publishing Our Report
Welcome back to day fifteen of our thirty-day series on Success in Power BI! Have you forgotten where we left off from day thirteen (as we updated on fourteen)? If so, here is the link to refresh your memory. Today we will publish our Power BI Desktop visualizations to a the Power BI service in order to share with other users.
The first step to doing this is creating an account on PowerBI.com. Don’t worry, there is a free account which lets you publish up to 1GB of data, share dashboards, and have access to cloud sources. If you need more than that, pricing information can be found here.
On the top ribbon, select the Publish icon. You will then be prompted for your PowerBI.com account and password as shown in Figure 1.

Figure 1 – Enter Account Information
At this point, the report will be published to the Power BI service as shown in Figure 2 and 3. That was easy, right?
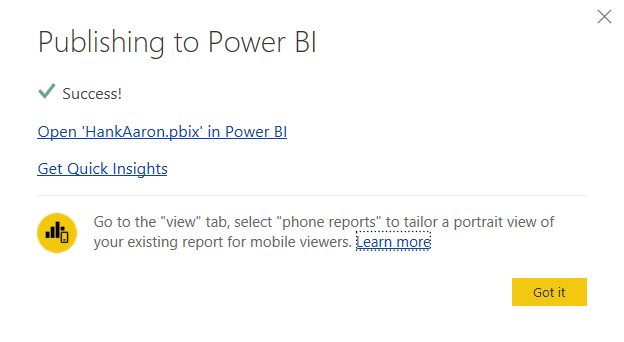
Figure 2 – Publishing to the Power BI service
Our report is now in the cloud! Are you excited yet? I am! Stay tuned to see where we go next!

Figure 3 – Our Report in the Cloud
Posted on April 25, 2017, in Business Intelligence, PowerBI and tagged PowerBI. Bookmark the permalink. 1 Comment.


Pingback: 30 Days to Success in Power BI: Day Sixteen Data Insights | SQL Swampland